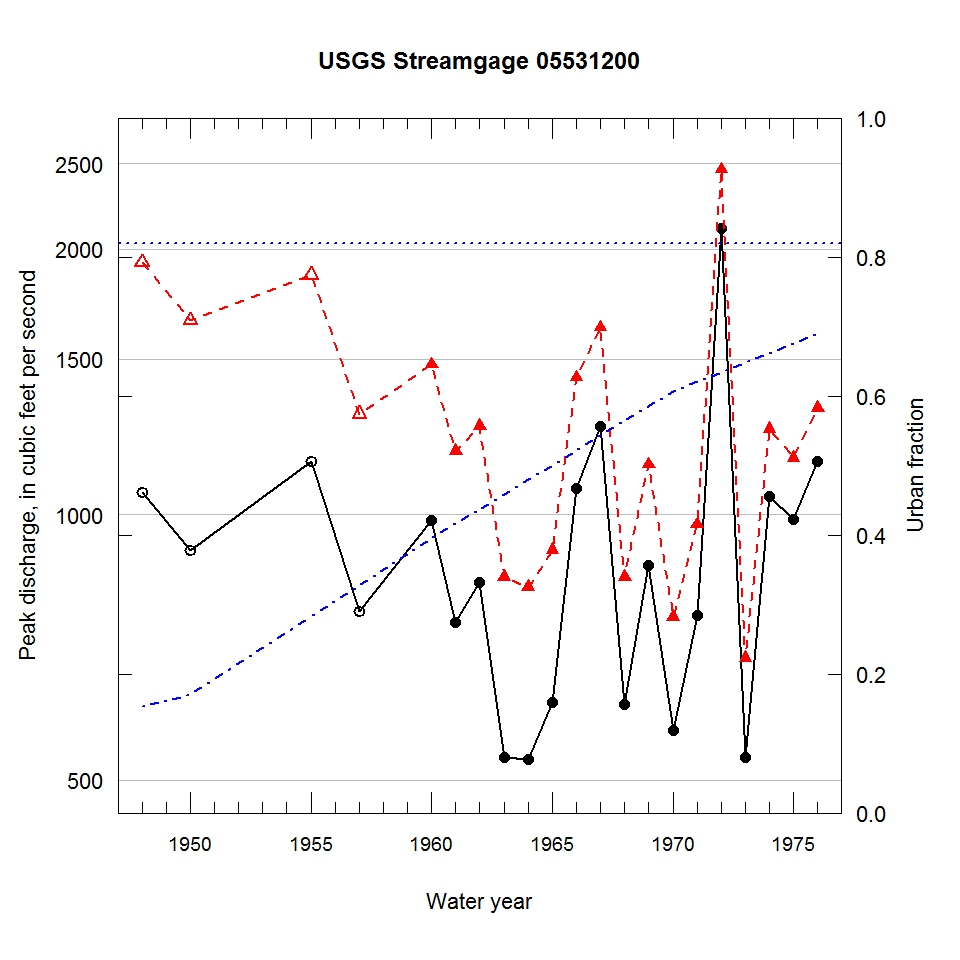
Observed and urbanization-adjusted annual maximum peak discharge and associated urban fraction and precipitation values at USGS streamgage:
05531200 SALT CREEK AT ADDISON, IL


| Water year | Segment | Discharge code | Cumulative reservoir storage (acre-feet) | Urban fraction | Precipitation (inches) | Observed peak discharge (ft3/s) | Adjusted peak discharge (ft3/s) | Exceedance probability |
| 1948 | 1 | 7 | 409 | 0.153 | 1.888 | 1060 | 1930 | 0.102 |
| 1950 | 1 | 7 | 409 | 0.171 | 1.232 | 910 | 1660 | 0.173 |
| 1955 | 1 | 7 | 409 | 0.283 | 3.456 | 1150 | 1870 | 0.118 |
| 1957 | 1 | 7 | 409 | 0.328 | 2.828 | 776 | 1300 | 0.369 |
| 1960 | 1 | -- | 409 | 0.395 | 0.381 | 984 | 1480 | 0.245 |
| 1961 | 1 | -- | 409 | 0.416 | 1.523 | 755 | 1180 | 0.467 |
| 1962 | 1 | -- | 409 | 0.437 | 0.241 | 838 | 1260 | 0.400 |
| 1963 | 1 | -- | 409 | 0.459 | 1.276 | 531 | 850 | 0.758 |
| 1964 | 1 | -- | 409 | 0.480 | 0.740 | 528 | 828 | 0.775 |
| 1965 | 1 | -- | 409 | 0.501 | 0.514 | 613 | 912 | 0.705 |
| 1966 | 1 | -- | 409 | 0.522 | 1.289 | 1070 | 1430 | 0.272 |
| 1967 | 1 | -- | 409 | 0.543 | 1.433 | 1260 | 1630 | 0.184 |
| 1968 | 1 | -- | 509 | 0.564 | 1.691 | 609 | 850 | 0.758 |
| 1969 | 1 | -- | 509 | 0.585 | 1.478 | 876 | 1140 | 0.501 |
| 1970 | 1 | -- | 509 | 0.607 | 1.339 | 570 | 766 | 0.822 |
| 1971 | 1 | -- | 509 | 0.620 | 0.368 | 768 | 975 | 0.646 |
| 1972 | 1 | -- | 509 | 0.634 | 1.246 | 2110 | 2460 | 0.043 |
| 1973 | 1 | -- | 509 | 0.648 | 1.241 | 531 | 688 | 0.880 |
| 1974 | 1 | -- | 509 | 0.662 | 1.040 | 1050 | 1250 | 0.416 |
| 1975 | 1 | -- | 509 | 0.676 | 0.949 | 989 | 1160 | 0.484 |
| 1976 | 1 | -- | 509 | 0.689 | 1.089 | 1150 | 1320 | 0.356 |

